The Top Technical Indicators For Options Trading: A Quick Overview
Oct 11, 2023 By Triston Martin
Introduction
Cryptocurrency traders use technical indicators to track and analyze a variety of historical crypto data, including but not limited to price, market sentiment, trading volume, supply and demand, and more. When developing a trading strategy, indicators can help pinpoint the best opportunities, both now and in the future. Choose a technical indicator from the many available if you want to trade in a manner consistent with your personal preferences. In this piece, we'll look at some of cryptocurrency option traders' most widely used indicators. But first, we'll quickly go over the key ways trading crypto options differs from trading crypto on the spot market and how that impacts the technical indicators we end up using.
Existing investors rarely show enthusiasm for options trading. Options are a type of financial instrument typically traded on a short-term basis. They are traded daily and used as a hedging instrument because of their complexity. The technical analysis informs the most effective trading indicators used by professionally trained retail traders. The vast majority of options traders' technical indicators are intraday indicators.
How Options Trading Is Different
In short-term trading, technical indicators are commonly used to help traders decide on:
How many steps does it cover? Which way does it seem to be going? How long has this trend persisted, exactly? Since options are affected by time, how long you hold them matters. Unlike stock traders, who have unlimited time to hold a position, options traders must close their positions before the expiration date. Time constraints and the nature of options trading mean that momentum indicators, which tend to reveal overbought or oversold levels, are frequently used by investors.
Most Used Intraday Trading Indicators:
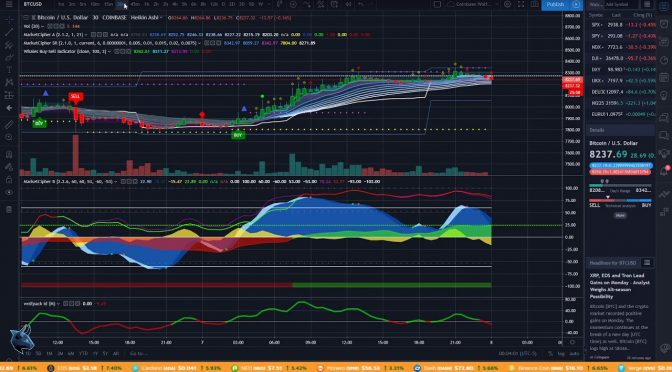
1. SuperTrend
First, we'll discuss the Supertrend indicator and how it can be used as a daily trading tool. The indicator is superimposed on the price chart, and the direction of the prevailing trend establishes its location in the price. The multiplier and period are the only editable settings in this uncomplicated indicator. In most cases, the Average True Range (ATR) and its multiplier of 3 are the defaults when developing a Supertrend indicator. Since the Supertrend indicator derives its value from the ATR, the latter serves as a crucial component of the indicator and an indicator of price volatility.
2. VWAP
VWAPVolume weighted average price is another indicator I like to use when trading intraday. Traders engaged in intraday transactions must monitor stock volume. The Volume Weighted Average Price, or VWAP, compares the total value of shares traded during a given period to the total number of shares traded during that period. Shares of a particular stock.
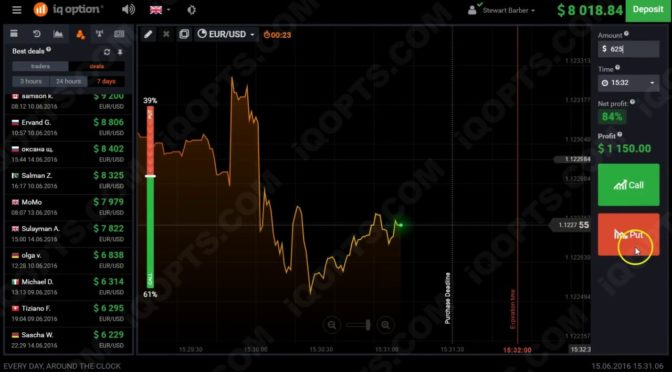
The Price Of A Strike
The current stock futures price is nearest to where options become easily accessible. As an illustration, if the Nifty is trading at 16523, the closest strike price for Call options would be 16500, and for put options, it would be 16550. To prevent premium loss due to time decay, closing your trade on the same day it is opened is best.
Time Decay
- When an option is in effect, the premium is estimated to decrease. So, a trader can use technical indicators when executing an option trade. Trades can be entered and exited based on signals from technical indicators used throughout the day.
- Put your time into investing, not only money.
- As a new trader, it can be challenging to identify promising opportunities. This is why you need to put in the time and effort to learn the ropes the hard way and become an expert player.
- Baby takes steps... At the very minimum, at the beginning.
- When you can't run, at least you can walk. Starting trading stocks doesn't call for going all-in right away. Keep your attention on no more than three stocks at a time. You'll be able to spot potential transactions this way.
- Do not buy penny stocks! New investors might be tempted to jump in with both feet by looking at penny stocks, but this is not the case. They can't be easily sold and won't help you make more money off your initial investment.
Conclusion
In general, RSI readings sit between zero and one hundred. In general, levels above 70 indicate an overbought market, while levels below 30 indicate an oversold market. When prices break above the Bollinger bands, it could signal a reversal is imminent. The flexibility of options trading allows investors to adapt their strategies to the current market environment. The intraday momentum index combines the concepts of intraday candlesticks and the relative strength index (RSI) to provide a useful band (similar to the RSI) for trading during the day by showing when prices are overbought and oversold.
When the MFI is above 80, the security is considered overbought. The security is being undersold if the value is less than 20. The put-call ratio indicates the extent to which put options are traded relative to call options. Indicators of shifts in market sentiment include fluctuations in its value. The level of open interest can be used to gauge the potential of a trend.


